1.Class diagram
The class diagram is a static diagram. It represents the static view of an application. Class diagram is not only used for visualizing, describing and documenting different aspects of a system but also for constructing executable code of the software application. The class diagram describes the attributes and operations of a class and also the constraints imposed on the system.
So the purpose of the class diagram can be summarized as:
- Analysis and design of the static view of an application.
- Describe responsibilities of a system.
- Base for component and deployment diagrams.
- Forward and reverse engineering.

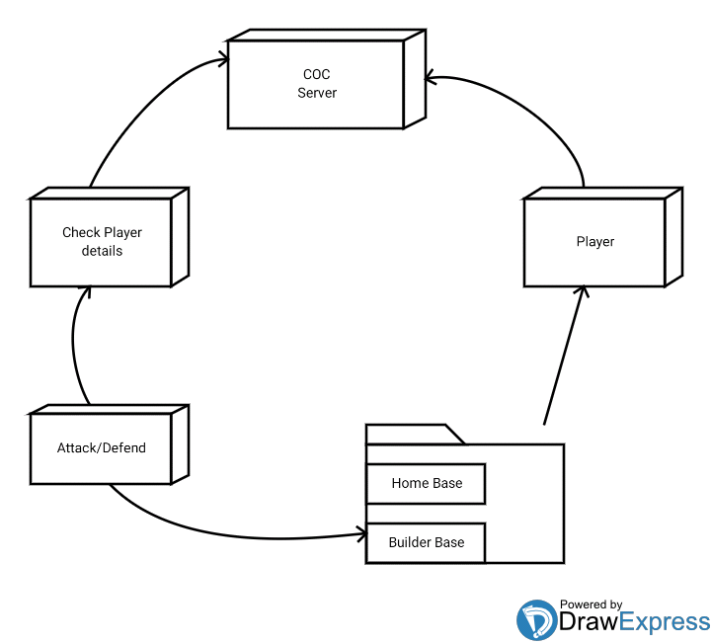
Class Diagram for Clash Of Clans

2.Use case diagram
A Use case Diagram is a diagram that shows a set of Use cases and actors and their relationships. These diagrams are used to model the static use case view of a system.
The diagram is used to model the system/subsystem ofan application. A single use case diagram captures a particular functionality of a system. So to model the entire system numbers of use case diagrams are used.
So in brief, the purposes of use case diagrams can be as follows:
- Used to gather requirements of a system.
- Used to get an outside view of a system.
- Identify external and internal factors influencing the system.
- Show the interacting among the requirements are actors.
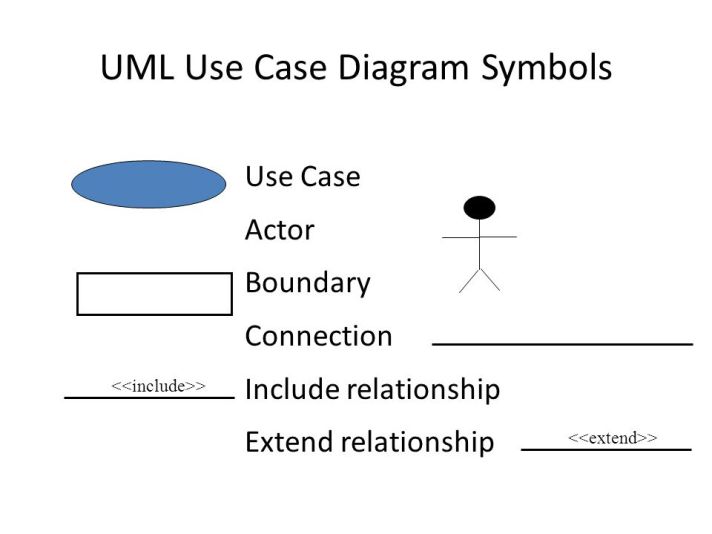
Use Case Diagram for Clash Of Clans

Activity Diagram
An activity diagram visually presents a series of actions or flow of control in a system similar to a flowchart or a data flow diagram. Activity diagrams are often used in business process modeling. They can also describe the steps in a use case diagram. Activities modeled can be sequential and concurrent. In both cases an activity diagram will have a beginning and an end.

UML Activity Diagram

Sequence Diagram:
A Sequence diagram is an interaction diagram that shows how processes operate with one another and in what order. It is a construct of a message sequence chart. A sequence diagram shows object interactions arranged in time sequence. It depicts the objects and classes involved in the scenario and the sequence of messages exchanged between the objects needed to carry out the functionality of the scenario. Sequence diagrams are sometimes called event diagrams or event scenarios.
A sequence diagram shows, as parallel vertical lines (lifelines), different processes or objects that live simultaneously, and, as horizontal arrows, the messages exchanged between them, in the order in which they occur. This allows the specification of simple runtime scenarios in a graphical manner.
Basic Sequence Diagram Notations
Class Roles or Participants
Class roles describe the way an object will behave in context. Use the UML object symbol to illustrate class roles, but don’t list object attributes.

Activation or Execution Occurrence
Activation boxes represent the time an object needs to complete a task. When an object is busy executing a process or waiting for a reply message, use a thin gray rectangle placed vertically on its lifeline.

Messages
Messages are arrows that represent communication between objects. Use half-arrowed lines to represent asynchronous messages. Asynchronous messages are sent from an object that will not wait for a response from the receiver before continuing its tasks. For message types, see below.
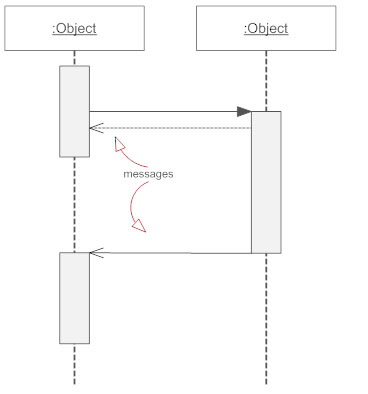
Lifelines
Lifelines are vertical dashed lines that indicate the object’s presence over time.

Destroying Objects
Objects can be terminated early using an arrow labeled “<< destroy >>” that points to an X. This object is removed from memory. When that object’s lifeline ends, you can place an X at the end of its lifeline to denote a destruction occurrence.
Loops
A repetition or loop within a sequence diagram is depicted as a rectangle. Place the condition for exiting the loop at the bottom left corner in square brackets.
UML Sequence Diagram

Component Diagram:
Component diagrams are different in terms of nature and behaviour. Component diagrams are used to model physical aspects of a system.
Physical aspects are the elements like executables, libraries, files, documents etc which resides in a node.So component diagrams are used to visualize the organization and relationships among components in a system. These diagrams are also used to make executable systems.

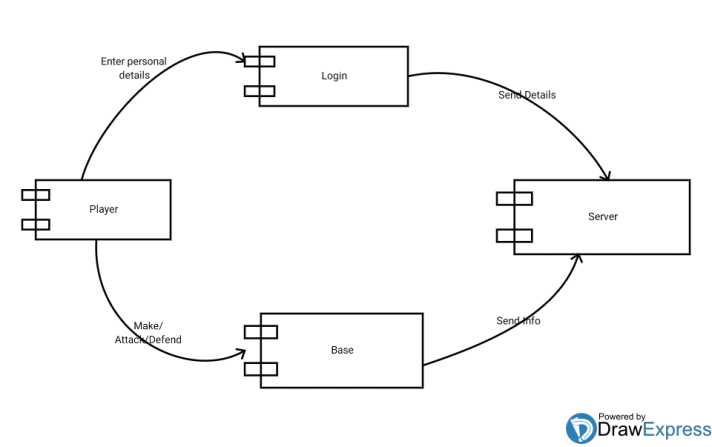
UML Component Diagram
Deployment Diagram:
Deployment diagrams are used to visualize the topology of the physical components of a system where the software components are deployed.
So deployment diagrams are used to describe the static deployment view of a system. Deployment diagrams consist of nodes and their relationships.
Notations:

UML Deployment Diagram :